TM 1-1520-238-T-4
Change 9
5–49
5–21.
FLIGHT CHECK AND ADJUSTMENT USING AVA EQUIPMENT (cont)
5–21
The polar chart showed that either blade 1 or 3 may need to be adjusted to move the vibration to the center, and
this track trend shows that blade 1 is the blade that needs to be adjusted. Adjustments should not be made based
on this track trend, the information from both the polar chart and the track trend should be used to make smart
decisions when running AVA diagnostics. This is emphasized here by the fact that if adjustments were based on
this track trend alone, blade 2 might also be adjusted, which will actually increase the vertical vibration as shown
in Figure 5–20.
1.40
AH64
333
FLOWN
11:58:00 28 AUG 96
ID TEST
AMP
[IPS]
PHASE
[DEG]
VERT
1R VER
G
A FPG100
0.11
0.12
332.65
109.39
B Hover
F
C
M58-0295-5
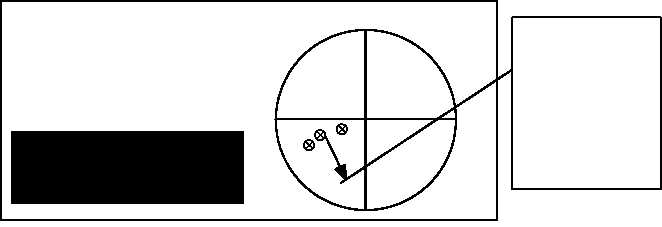
This is the direction
that the vibration
readings would move
if the tab or pitch link
was adjusted up on
blade 2. All of the
vibration readings
would move away
from the center of the
circle and get worse.
C 60K
D 80K
E 100K
F 120K
G 140K
0.33
0.57
0.55
0.55
1.02
242.17
251.20
249.86
252.82
248.75
Figure 5–20.
Polar Chart
As the caption says above, if blade 2 was adjusted to bring the aircraft into track that would be a mistake and
would increase the vertical vibration (refer to the AH-64 coefficient polar chart for vertical vibration shown in figs.
5–21, 5–22, and 5–23).
In this particular example the default AVA solution had seven adjustments and after turning on the Resolve to
Limit option (this option will be discussed in the custom solutions section) the solution was only one adjustment,
which was -1.5 degrees tab on blade 1. This move made sense according to the previous displays, and after this
adjustment was performed the aircraft was within limits.
All this information in the displays should not be used to make corrections, this should be used to make changes
to the diagnostics to obtain a better solution. After all this information is reviewed it’s time to enter Diagnostics.