TM 1-1520-238-T-4
5–54
Change 9
5–21.
FLIGHT CHECK AND ADJUSTMENT USING AVA EQUIPMENT (cont)
5–21
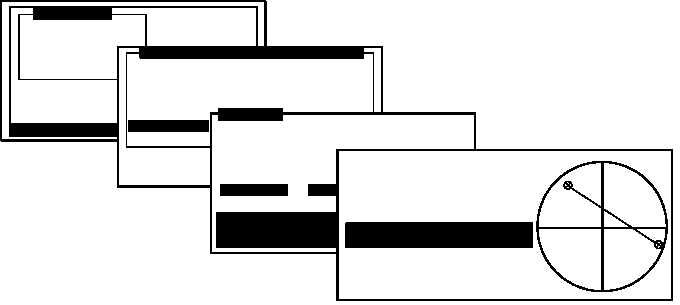
Figure 5–24 displays the vibration trend from the latest reading with previous readings on a polar chart. This
process is displayed below.
One Test State
Complete Flight
View Limits
Summary Displays
Display Mode
Trend Flights
[ DO ] Select Options
M58-0295-1
100K 1R LAT
100K 1R VER
120K IR LAT
120K 1R VERT
140K 1R LAT
60K 1R VERT
60K 1R VERT
80K 1R LAT
80K 1R VERT
FPG100 1R LAT
140K 1R VERT
DISPLAYS
DO–Select QUIT – Exit
Enter the number of tests
to show on the polar plot
at one time.
No. of Test: 2
[UP]
[LEFT]
[DO]
&
&
Save & Exit
[DOWN]
[RIGHT]
Draw Axis
NO
Entry Form
0.50
AH64
365
CURRENT
14:47:00
21 MAR 96
ID FLT
AMP
[ips]
PHASE
[deg]
140K
1R VER
A
B
A
B
CURRENT
12:23
0.44
0.44
323.22
114.65
Figure 5–24.
AVA Vibration Trend
The AVA’s goal is to give corrections that will drive the vibration levels towards the center of the polar chart. The
question you ask when you are viewing the polar chart is, did the vibration levels move towards the center of the
chart of go through the center of the chart. In some cases you will see the vibration trend go through the center of
the chart and overshoot to the other side. This is a clear indication that the aircraft is responding to the moves in a
normal manner, but the amount of the move was too much. The phase information is very important and these
polar charts should be used to verify the reaction of the aircraft.