TM 1-1520-238-T-4
5–60
Change 9
5–23.
TAIL ROTOR BALANCE – MAINTENANCE OPERATIONAL CHECK USING
5–23
AVA EQUIPMENT (cont)
k. Enter the MEASURE mode by pressing F1. Verify that test state FPGTL is highlighted.
l. Press DO when aircraft is stable at highlighted selection. Reverify that aircraft is at required test state
and press DO again. AVA will acquire balance data and return to selection menu.
m. After measurement is completed, press DO on “finish”, then press DO on “diagnostics”. If measurements
are within specified limits, press QUIT to main menu.
n. If results are less than 0.2 ips, no corrections are required. However, AVA may offer corrections to
smooth rotor further, at operator’s discretion. Even though limit is 0.2 ips, tail rotor can achieve 0.1 ips or
below in most cases, and is recommended to try and obtain the 0.1 ips goal.
o. If measured values exceed specifications, press DO and perform corrections as shown.
p. Perform tail measurement again and verify corrections.
2. COMPARE MOVES BETWEEN RUNS
a. It is always recommended to compare the vibration from one measurement to the next (mainly to ensure
that the aircraft is responding in a normal manner). For the TAIL flight plan there is only one reading to
trend. To trend this, perform the following:
With the latest flight id picked enter the Display mode by pressing F2.
Select Trend Flights and press DO.
Press DO on 1T POLAR.
Enter the number of test states to trend (the easiest to understand is just trend the last two flights
by entering 2, this will trend the most current flight with the previous flight), then arrow down to
Draw Axis and change to NO by pressing the right arrow (this will make the polar chart easier to
read), and then press DO.
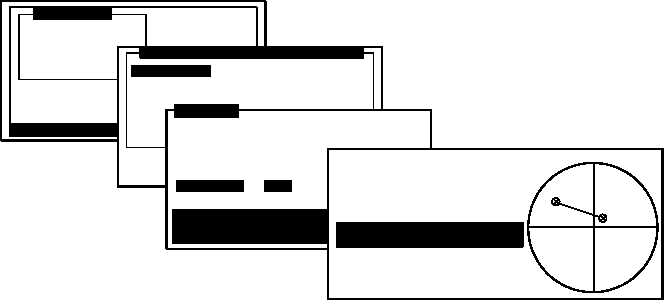
b. This will display a vibration trend from the latest reading with previous readings on a polar chart. This
process is displayed in Figure 5–27.
One Test State
Complete Flight
View Limits
Summary Displays
Display Mode
Trend Flights
[ DO ] Select Options
1T POLAR
DISPLAYS
DO–Select QUIT – Exit
Enter the number of tests
to show on the polar plot
at one time.
No. of Test: 2
[UP]
[LEFT]
[DO]
&
&
Save & Exit
[DOWN]
[RIGHT]
Arrows
Arrows
[QUIT]
Draw Axis =
NO
Entry Form
0.50
AH64
24210
CURRENT
10:10:00
11 MAR 94
ID FLT
AMP
[ips]
PHASE
[deg]
FPGTL
1T
A
B
CURRENT
09:30
0.07
0.26
18.23
306.12
A
B
M58-0293-2
Figure 5–27.
Vibration Trend Polar Chart